 As an analyst for many brokerages, franchises, and MLSs, WAV Group looks carefully at reports from publishers to understand dynamics that can be leveraged to enhance performance. Sometimes, we encourage firms to keep their strategy the same. At other times we encourage trying something new or redeploying investment.
I like Trulia’s reporting. It is something that other publishers (including their parent company) could benefit from. Below I will provide a discussion about each.
Leads – in their purest form, leads count. Even bad leads. If you are a broker and you are not producing leads for your agents, you may have another problem. Good leads are better. Have the office managers look at the leads every week. Lets face it. There are not that many to call it a huge job.
Look at the ratio of leads to listings. Is that number going up or down. Generally speaking, most brokers see the most volume of leads per listing from Trulia and the highest quality of leads from MLS consumer sites or Realtor.com
Visits – The whole idea of having a link to the broker website is to drive consumer traffic to your broker website. Hopefully your website will delight them and the consumer learns that they can get great service on top of great listing content there.
Look at your lead conversion ratio by publisher. How many leads do you convert from traffic that comes from Trulia or other publishers? What is your bounce rate? If you do not know how to track this stuff, WAV Group can help.
Listings – The key number here is accuracy. Are all of your listings on the site? Most brokers find that the number is off. Do an audit! Look at the data sheet to see which ones are missing or should be removed. Look at the listing price to make sure it is accurate. There are always problems with this because of overlapping data feed disorder and trumping rules. It is spaghetti that solid broker data management policy can repair.
Views – We tend not to look at views very carefully, mostly because we do not know if the views are machines scraping data from Trulia or real consumers. It is more interesting to see analytics on property detail page views and I would love to see more granular information like time on page, photos viewed, and exits.
Reading The Changes
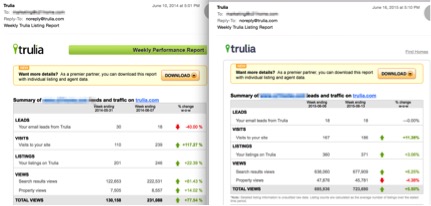
These reports contrast real reports from a real broker for this week vs the same week last year.
Good News
Trulia Traffic – Trulia has huge traffic growth in this broker’s market – running up their search views from 222k to 677k. They also an even better percentage of property detail views growing from 8500 to 45000!
Listings – This broker is doing well, they have grown their listing inventory from 239 to 371 year over year. I happen to know that days on market is shorter this year than last year, inventory in the MLS is about the same, and that overall agent count is about the same. Kudos to the agents and managers for growing market share!
Bad News
Leads– The broker had exactly the same number of leads – 18. And before you get crazy trying to understand why, there is no reason. We checked the weather (perfect California) and the special events. We could not determine any accountable reason. More over, there was a huge drop in leads per listing. Only 18 leads per 371 listings is far worse than 18 leads on 239 listings the year before. How could Trulia grow their traffic so much and not deliver more leads when the broker’s inventory grew?
Visits – The broker had 186 visits this year, down from 239 visits in 2014. This is also confounding. The broker has more listings on Trulia and Trulia has far more visitors hitting the listing detail page – but the number of visits are going down.
Don’t Take This Too Seriously – This is just one broker in one area of the country. It gets more interesting as the data gets bigger, which is why we loved Listhub reports and are hopeful that Listtrac will be able to get a federated report back into the hands of brokers and agents who need them to make smart choices on where they are publishing their listings. You should also realize that there are regional differences that can cause dynamic changes. Moreover, this is just a one week snapshot. You can fill the funnel all you want, sometimes leads and visits do not drop out of the other side.
Even still – there is much that cannot be explained that questions the value of all of that consumer traffic growth. It does not seem to have delivered much in the way of improved lead generation or website traffic for this broker this week.


