As I close out my first year as an independent consultant, I am grateful to the people who allowed me to assist in their business challenges. With every day being a new opportunity for learning, I thought I would share some experiences that I have encountered over the past year.
Data and Business Intelligence (BI)
WAV Group and I have new internal initiatives around the data we collect. Our focus is on using BI tools so that we become more efficient and effective in the research we perform for our clients. We perform data analysis to answer questions about the effectiveness of online strategies. As such, it reminded me how BI Tools have more benefits than just for business intelligence.
Why is it important for real estate to be thinking about this technology space?
Transforming Data With Intelligence (TDWI) recently released a best practices report titled, “BI and Analytics in the Age of AI and Big Data”. TDWI surveyed 250 companies to seek insight on their 2019 investment prioritization of new technology and/or cloud-based services to improve their BI and analytics. Key takeaways from the article for me are:
At least 70% of enterprise companies are highly prioritizing their technology and/or cloud-based service investments into: storage of data, cleansing of data, data warehouse, self-service BI and business analytics, advanced analytics such as predictive analytics, and centralizing their enterprise BI and analytics.
A majority of these companies – over 74% – listed that their main business driver for 2019 is to improve operational efficiencies and effectiveness while measuring performance and key performance indicators was a close second. By investing in new BI technologies and cloud-based data services these businesses can accomplish these goals.
User Story
I’ve written about Microsoft Power BI as a data analytics tool in a few articles, here and here. During the creation of a technology budget for a client, I was able to use Power BI in a process to more effectively and efficiently filter through 2018 expenses.
Previously, their accounting department was using a complex Excel spreadsheet with macros and formulas to manage the company’s 2018 expenditures. The complexity was not only in the spreadsheet but was also embedded in the client’s business model. The client manages 13 independent subsidiaries across three brands. Imagine modeling this budget!
Opening and filtering through the spreadsheet were painfully slow on my MacBook Pro which was running the latest and fastest version of Excel. Evaluating the data in this manner is incredibly tedious and as Squints from the movie Sandlot said took, “FOR-E-VER”.
After a couple of hours, I couldn’t take it anymore. I exported the expenses into a CSV file, used Power BI to ingest the data into a table, performed some data cleansing, and created buttons and selection boxes to filter the expenses. The buttons and selection boxes filtered the data by brand and subsidiary, by month, and by general ledger code.
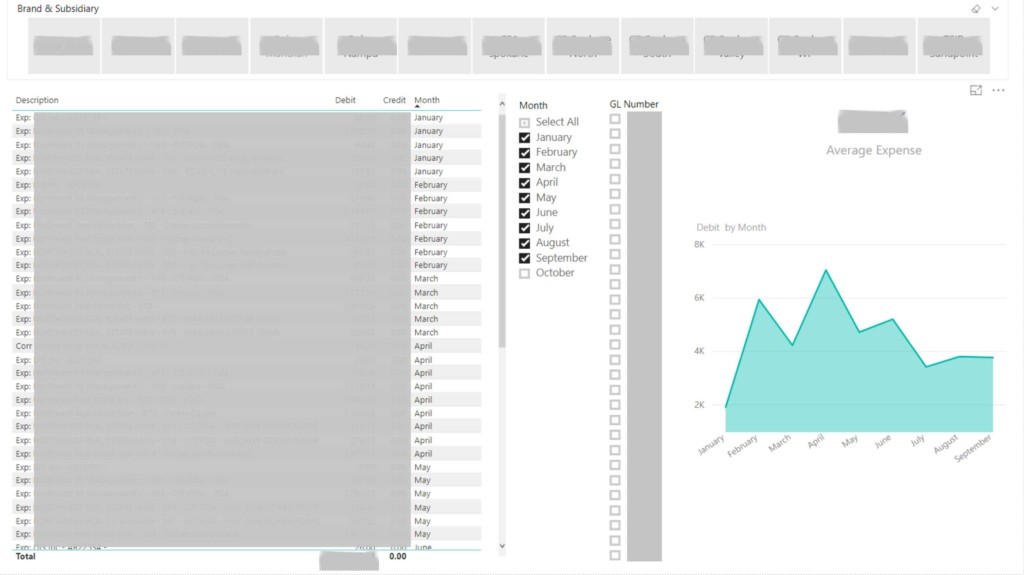
It took longer to redact the above content in Photoshop than to ingest the data and create the above Power BI dashboard.
Through this simple afternoon project, I was able to demonstrate the utility of Power BI as an effective tool to the CFO and senior accounting person. Together, we have developed a strategy to implement Power BI in their accounting workflow for 2019 eliminating the need for the cumbersome Excel files and providing real-time business insight.
Designated Market Areas BI
Another area we have been looking to improve is constructing insights from marketing and other data by DMA. This is where visiting my data scientist son during the holidays was helpful.
I was explaining to Ryan the process I was using to pull together DMA geographical data for Power BI. The process was somewhat cumbersome and there were potential points of failure throughout the process. Together, we found a method and were able to pull together this map in Power BI with DMA information.
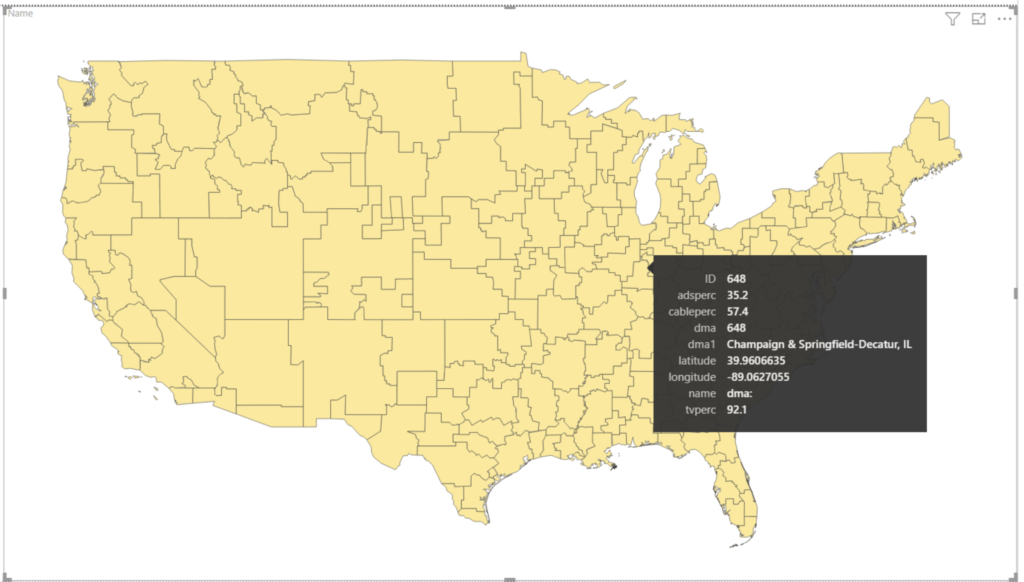
We now have a DMA map to plot other data like demographics, marketing campaigns, leads, and listings to fashion interesting research and data analysis.
My investment for 2019
Ryan and I have been in a debate for the last two months on the benefits of the two leading BI tools available today. He has been on the Tableau side, while I have been touting Power BI.
Ryan started to show me some of the work he has done in Tableau for research projects and other business endeavors. After much discussion and debate, it was time to look at Tableau for me.
Earlier this month I signed up for the free 14-day trial of Tableau. Subsequent to reviewing some tutorials on the fundamentals, I was very much impressed with Tableau’s ability to create dashboards. I still like Power BI for data cleansing competencies, but every consultant should be well versed in different tools to get the job done.
My 2019 priorities in an investment of technology and cloud-based services in BI and data analysis was twofold. The first investment was to upgrade my Office 365 subscription with Power BI Pro. A Power BI Pro subscription can save dashboards to the web for presentation and allows me to share information with clients. It also enables us to use the embed features to display the RESO OUID map found in this article.
Additionally, I made an investment into a Tableau Creator with Tableau Online Server license. Now, we will have the ability to work together and provide clients with dashboards to help them improve the overall efficiency and effectiveness of their business.
Your 2019 Investment into Data and BI
2019 is just an infant and yet there is a ton of information in your databases. If you don’t have an enterprise strategy for data and BI, there is still time to evaluate and determine where these tools can help with your business drivers. There is no better time than now to review your business strategy. It is no surprise that enterprise companies in other industries are prioritizing their investments. A strategy for enhanced return on investment is making them smarter in their business decisions.
Take small steps to achieve an overall incremental improvement to your business.


