 In talking with various people inside brokerages, I hear the same challenge time and time again. “My data is all over the place and I have no way to understand what it means.” Driving what your data means and information out of your data is Business Intelligence (BI). There are free or low-cost solutions to help analyze data in your control and derive the answers to make better business decisions.
Working with Microsoft Power BI Desktop and Google Data Studio gives you the ability to pull data from multiple disparate sources. Using data connectors, there is a plethora of opportunities to dive into database servers, SaaS applications, social media API’s, Web Analytics, and Google Sheets or Excel.
There are other BI Visualization tools on the market such as IBM Watson Analytics and Tableau Desktop. The advantage is Data Studio and Power BI afford free easy access and give plenty of documentation to help the user learn how to use these tools.
The Question?
The following simple questions are what every brokerage should be asking their Business Development and Customer Service teams.
What time of day are consumers the most active in sending inquiries?
What is the average listing price point for these inquiries during that time of day?
How does the time of year impact/relate to consumer inquiries?
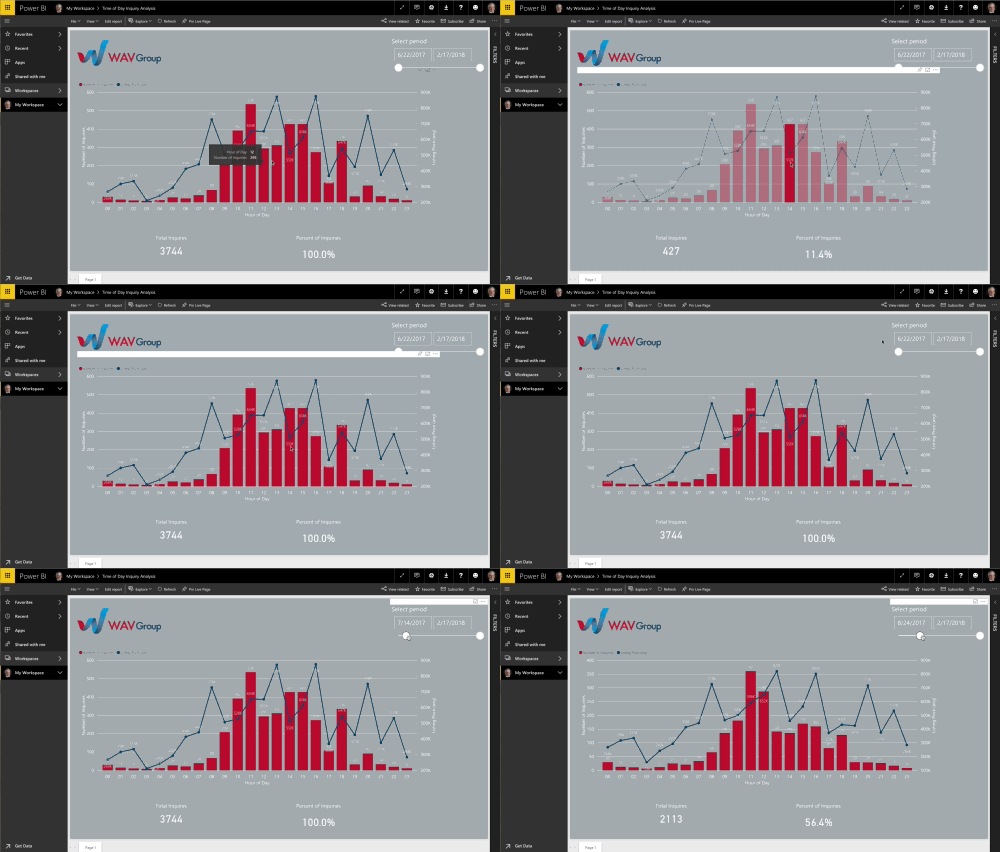
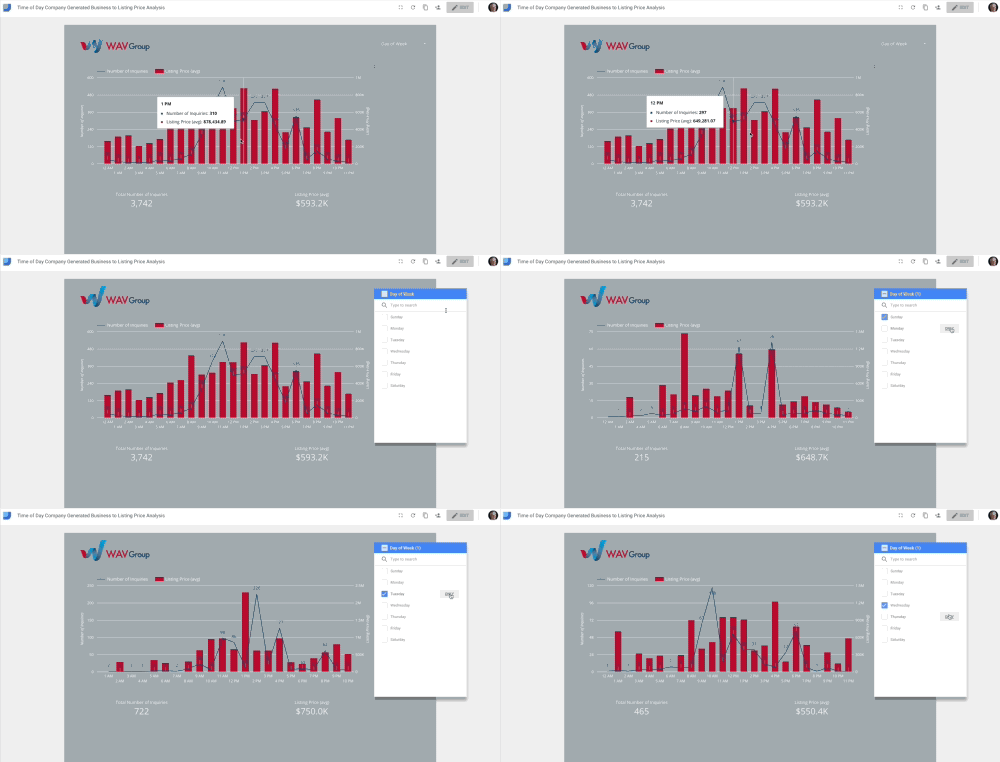
If you have answers to these questions, what strategies could you employ to ensure your brokerage is delivering the right consumer experience. The following are my thoughts and example on how Power BI and Data Studio carries out this goal.
Microsoft Power BI
Power BI Desktop installs only on Windows 10 devices. It is a full fledge client software so therefore doesn’t need access to the Internet to build your visualizations. Once you pull the data from the source, it lives within the Power BI file. The desktop client is free to author visualizations.
Microsoft is more mature in its product offerings than Google Data Studio. Microsoft also has a suite of Power Bi products which include Power BI Service, Power BI Mobile Apps, Power BI Gateways, Power BI Embedded, and Power BI Report Server. This is a portfolio of tools which Microsoft continues to drive their BI strategy for small and enterprise businesses. Power BI’s integration is tight with Microsoft’s portfolio or products and Azure Cloud Services.
Both Data Studio and Power Bi support calculated fields. Google uses formula features found in Google Sheets. Power BI has its own language called Digital Analytical Expression, or DAX, to create calculated columns and measures. DAX does take a little time to understand, but there is plenty of information on the web to help shorten the learning curve.
A big feature for Power BI is the AppSource store where you can download custom visuals. Most are free for download to install in Power BI. Additionally, data analyst’s love Power BI’s ability to create visualizations with their favorite R programming language.
Google Data Studio
Google Data Studio is only in Beta release. Don’t be surprise if features change or things do not work as expected. Still, the tool is functional and is a delight to use. As with all Google products, it is web based and Internet connectivity is mandatory.
What is missing from this product is the number of connectors to data sources, the number of visualization options, no tool tip customization, and lack of support to blend data sources for deep analysis.
As expected, there is full integration with Google’s portfolio of products. Other features include sharing and collaboration, connectors to the major data sources, starter kits and templates, and support for the developer community to build more features.
The Coolness?
The visualizations are very interactive and are dynamic. Filter features enable the end-user to run through different scenarios in exposing information that is normally hidden. Once you become familiar with either tool, it doesn’t take long to throw data together and build out a dashboard. On average it takes approximately 3 hours to build reports from both these tools.
Building a BI presence in a brokerage is only going to enhance business decisions. This is a skill set that is becoming not just a “nice to have”, but is a “must have”. The WAV Group has the capability to aid in developing your BI presence and to perform analysis on your business. Contact us to figure out which products and insights can be a benefit to your business.


This is not only well written and informative, but takes a difficult subject and makes it understandable! THANK YOU DAVID!