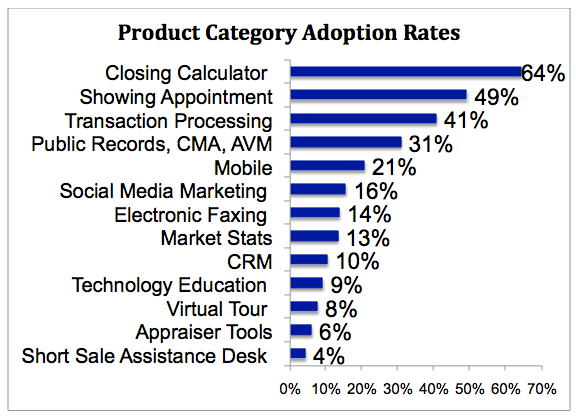
 MLSs face many decisions about what technology services to offer to their members. Budgets are tight and decisions need to be better justified than ever before. MLS technology committees and leadership need to sift through hundreds of products and multiple presentations before deciding what types of products make the most sense for their members. It is a difficult and expensive task to provide meaningful, relevant and contemporary product offerings to help agents and brokers better serve the needs of their clients. The first annual WAV Group MLS Technology Adoption study was designed help MLSs better understand the types of technologies being used most often.
The attached report is deigned to MLSs have a better understanding of what successful adoption looks like. The report is also designed to provide you with tangible ways to improve adoption of the technologies you have chosen to offer to your customers.
Here are a few of the takeaways from the study that we found most interesting:
Top Producers DO Matter More
The study proved, once again, that the 80/20 rule is alive and well. In just about every case, 20% of MLS subscribers complete 80% of the transactions. It is clear that top producers and aspiring top producers are the two most important groups for technology adoption. These groups are the most proactive in many respects and their technology adoption patterns are no different. They use more technology than others because they are transacting more business and looking for new ways to differentiate themselves. To ensure a successful rollout, MLSs need to consider the needs of top producers.
Even with this type of sales concentration, most MLSs still think of adoption based on their entire subscriber base. This is simply not realistic and can even be dangerous. If an MLS chooses technology based on the need to achieve adoption for the masses without thinking about the true value of the tool, they may make decisions based on the lowest common denominator, rather than providing the best tool for the most active producing agents
Technology decisions need to be made to serve the needs of those that are driving the industry with transactions. Instead of thinking about achieving 40% adoption of all customers, how about thinking about 50% adoption of the most productive agents?
Here’s a more meaningful way to project and calculate adoption of technologies considering the concentration of sales success among top producers:
Top Producer Adoption Calculation
Number of Subscribers: 10,000
Percent of Top Producers: 20%
Number of Top Producers: 2,000
Total number of Users: 1,000
Top Producer Adoption 50%
Adoption Percentage of Total Subscribers 1,000/10,000 = 10%
Adoption Percentage of Top Producers 1,000/2,000 = 50%
While 10% adoption is not considered a huge amount of adoption using traditional calculations, it is actually quite impressive considering the concentration of sales activity within the industry. Newer tools like Mobile Search, RPR, Electronic Signatures and others that achieved and even exceeded these percentages are quite impressive. Instead of looking at the entire subscriber base, it’s important to evaluate adoption based on the much more refined number of top producers.


