This week’s adventure found me looking at Agent tool usage reports from a bunch of technology companies. An MLS client was interested in gaining insight to members usage of their technology product offerings. All I have to say is, “REally!”
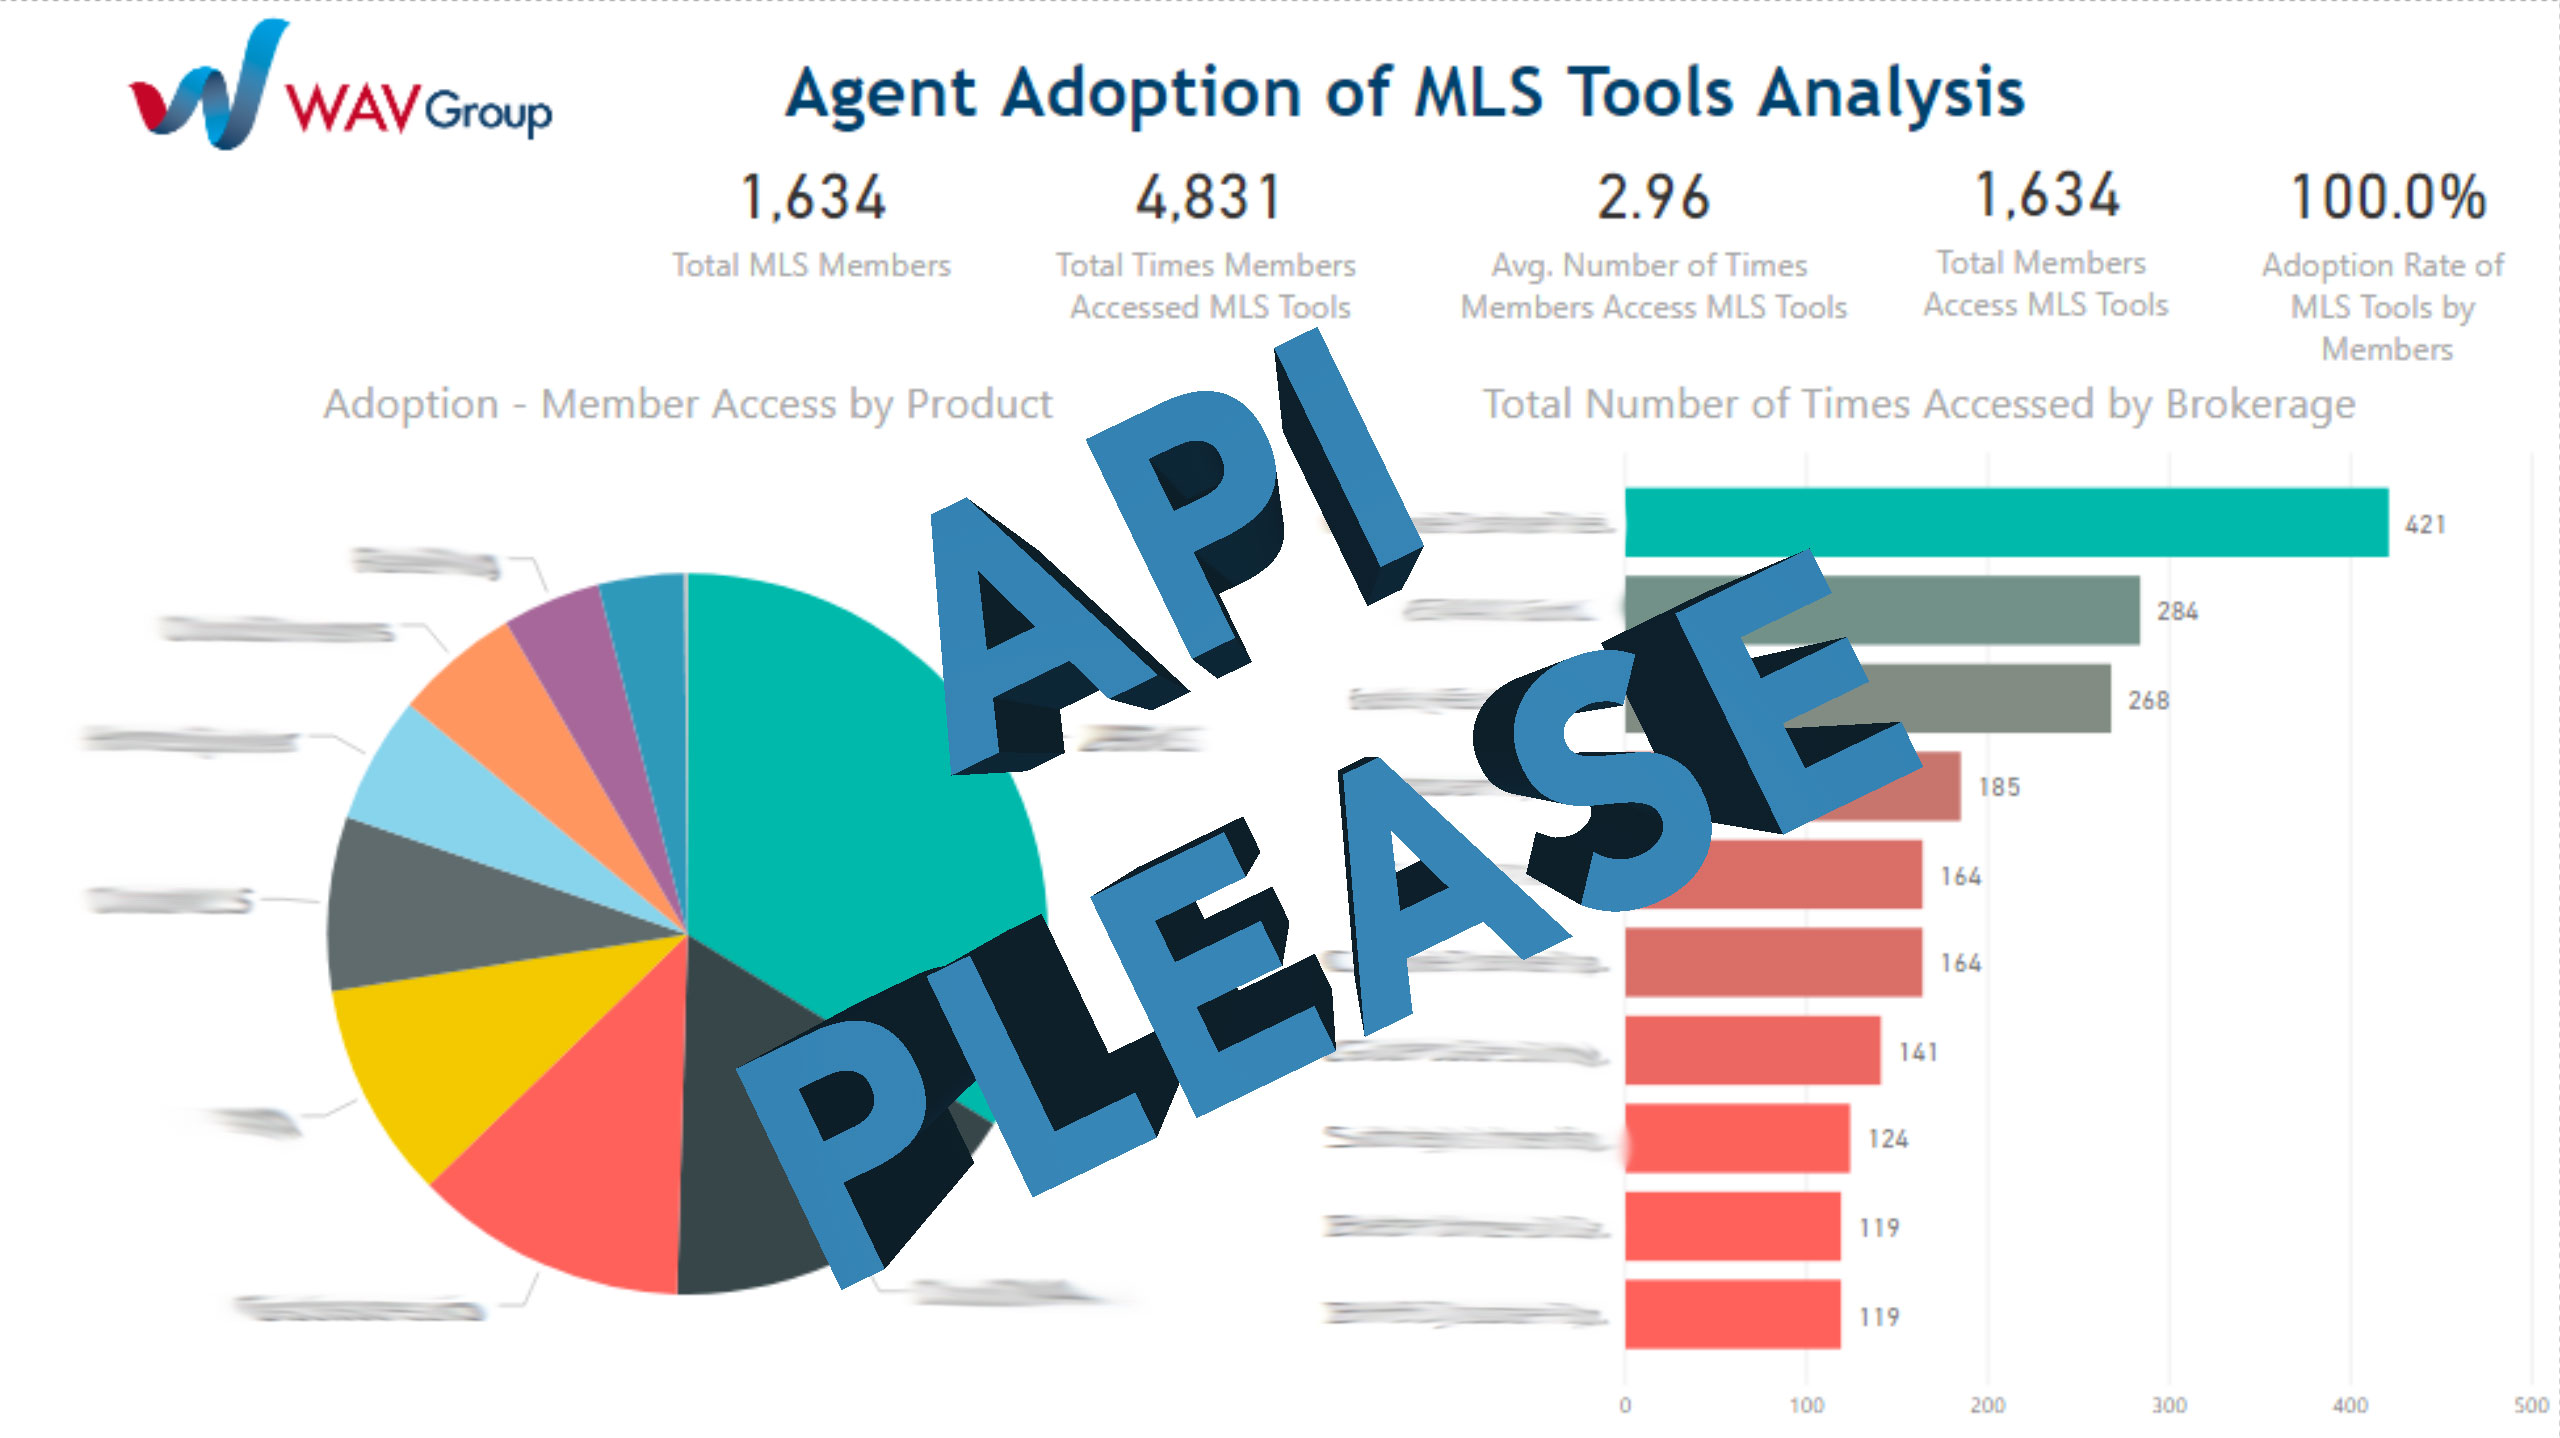 I was really not surprised to see the usage reports from the various technology companies. You see, usage reporting from technology partners are the bane of my existence. This wasn’t going to be any different as I dug into the data that was provided to me.
As CIO for a brokerage, the question of which tools Agents were or were not using would often raise its ugly head. The information is tremendously valuable to me and the company, but the ugly part was the jumping through hoops to collect the data.
The Painful Steps
A gross amount of time was spent accessing each technology partners admin dashboard to export usage reports – if it was available. If not, then it was a call or email to my account representative to request the report.
Naturally, each export had a different structure and type of information. This meant more time to normalize and organize the raw data. How amazing it is to spend your day importing into a SQL database only to have it fail for a variety of reasons.
This doesn’t include when the report changes format or the changes to the report are only available in the admin dashboard.
Yes, it has become easier over the last few years with the new data visualization tools like Microsoft Power BI, Tableau Creator, and Google Data Studio. Even so, this project took me a little over four hours to normalize and cleanse the data.
Technology Companies – Call to Action
Throw away that outdated usage reporting strategy! There is no reason why MLSs and Brokerages have to “export” files. Please build an API endpoint for this and any other reporting metrics.
Keeping current reporting strategies that are web-based or require exporting, just creates a silo of information. Unleash the power of data by allowing clients to marry product usage data with the other data within their ecosystem. A wealth of information and actionable items has the potential to awaken a more competitive client.
An API offering makes the most sense. API’s have become the status quo for delivering and retrieving data. It is time to take it to the next level for reporting.
My API Endpoint Requirements
Of course, I am going to provide requirements of what the API should look like. This list is very basic, and extension is always possible.
I do have to say life would be so much easier if everyone followed one standard. Maybe RESO should look at this, as well as, other reporting data.
Usage Data Structure
Customer API Information:
- MLS Member Identifier – Unique id assigned to an MLS member by the MLS
- Brokerage User Identifier – Unique id assigned to Agents and Staff by the Brokerage (only for clients who are Brokers).
- Vendor User Identifier – Unique id assign to users of the technology company’s product
- First Name – First name of the Agent or Staff
- Last Name – Last name of the Agent or Staff
- Email – Email address of the Agent or Staff
- Account Creation Date – The date when the account was created in the technology company’s product
- User Status – Active or Inactive – Need historical data
Usage API Information:
- MLS Member Identifier | Brokerage User Identifier – Either one is optional depending on the customer.
- Access DateTime – The date and time the Agent or Staff accessed the product
- Time Spent on Product – The total time the Agent or Staff started a session to when they leave.
API Service Offerings
Help clients by creating a custom connector for each data visualization tool. Custom connectors are easy to build and maintain. Doing this empowers the data analyst to connect without the need for a high-level of technical knowledge.
I would only focus on the data visualization tools that I mentioned previously in this article. They are the most common and have the most documentation.
Build dashboard templates for different data visualization tools. Differentiate by offering analytical insights that the MLS or Brokerage would not have noticed if they built their own.
MLSs and Brokerages – Call to Action
MLSs or Brokerage’s need to have a least one person with a little knowledge of how to use data visualization tools. Long-term benefits are found through empowering a person in finding actionable insights for the company.
Even more important are potential answers to the following questions:
- Which tools have adoption by Agents and how often do they use the tools?
- Who are using the tools and is there a difference in productivity?
- What difference does a product or tool make in an Agents production?
- Which tools are used most by production quartiles?
- Is there a correlation or causation of an Agents productivity based on a set of tools?
- How do training and tool usage impact Agents productivity?
The last question hooks up training data into the equation. Imagine what other combinations of information are available in the company.
Summary
Over the last year of my travels, I have seen other industries invest heavily in their data. Industries such as the shipping, airline, media, and healthcare.
Real estate has been late to the game to adopt. There are very few like Pacific Union that have seen the light of knowing what the data is telling them.
When a company does invest, the ability to have information at their fingertips is awesome. I know one brokerage who has taken the plunge into Microsoft Power BI. What they built provides their senior leadership with information that is based on facts and not on gut-feelings.
WAV Group is investing in the analytics business as written here and will continue to build. We have a small team who can do data analysis, data visualizations, data engineering, and machine learning modeling.
With margins growing smaller and as competition for business continues to grow, it is important to have information that is high in quality and accurate. Call David Gumpper, President of Business Intelligence and Technology and let’s have a conversation about your data analytics strategy.


Actually, RESO (by way of the R&D Workgroup) has been working on a reporting standard for Vendors and MLSs. Reach out to Greg Moore for details.
Thanks John. This is great news. I will reach out to Greg. Again, thanks.
This is a great article and very insightful. It is important to realize that valuable data extends beyond just MLS data. The ability to coral data and analyze ii from all broker applications and data sources would put brokers and agents in a sweet position. They would be better informed about their business operations and better able to educate their clients.
I agree with you, Debra. There is valuable data all around a brokerage and an MLS. It is WAV Group’s position that the time is now for brokerages and MLSs to collect and analyze all their data from their operations. Some are already doing this, but most have not yet ventured into this discipline. A more informed business can only be that much more competitive in today’s market. This is why we have built a center of excellence around data analysis, data engineering, data visualizations, and machine learning for real estate.
I hope people read this article David. The headline caught my attention and yet the headline didn’t do adequate justice to the content of your post. I’ve been saying for years that the real estate industry needs to wakeup and take queues from other industries. What the real estate industry puts up with from technology companies is shameful. Import/Export is so old school. What companies have to realize is the “cost” to support the import/export approach far out weighs the cost to implement effective API integrations and API availability. Besides, importing and exporting data is not real time. By the time you “import” your updated customers your competition has already created a video, placed a retargeting ad, and ordered marketing material…all without touching anything all because of APIs.
…I should also add that some companies in the space are making tremendous progress when it comes to API availability and real-time data integrations 🙂
Hi Mike: Thanks for the kind words. I completely agree with you. In a brokerage model, we always are looking at measuring consumer engagement with our websites, marketing campaigns, floor desk, listing showings and wins/loses in listing presentation. It is time to look at how the tools we use are or are not a benefit to Agents productivity.
I was on the RESO Board Liasion Committee meeting today and spoke about this topic. I was informed that the Internet Tracking Workgroup has been making some headway on this topic. Time to connect and see how we can at least have standard to make it easier for everyone to follow. Would love to have you join us.